Logs
Logs lists the traces your app sends: one trace per request or agent run, made of spans (the agent, each model call, each tool call, each retrieval), with the input and output, status, latency, tokens and cost.
Traces come in through the SDK, the AI Gateway or OpenTelemetry, with a project token that may upload. Until the first one arrives, the page shows the three ways with your project's values; "Connect a new source" opens them under Targets. Start with the logs quickstart.
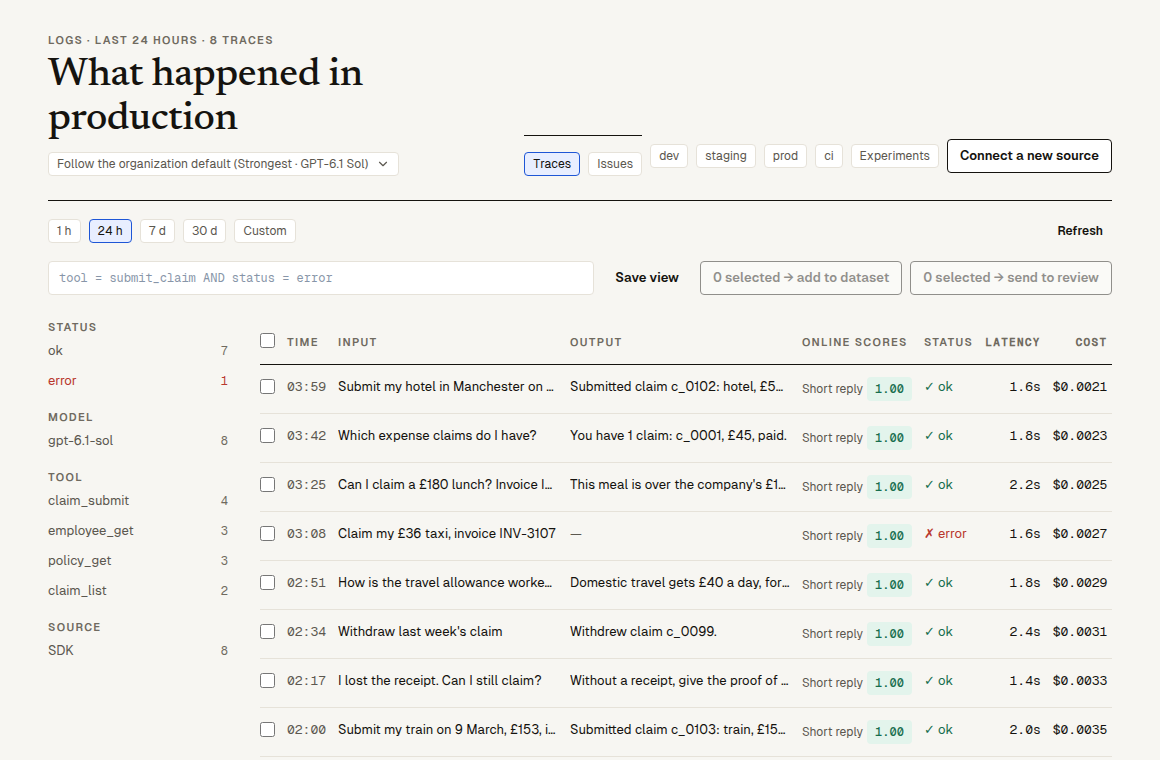
Find traces
- Time range: "1 h", "24 h" (the default), "7 d", "30 d" or "Custom" (up to 31 days), and "Refresh".
- Environment: the chips
dev,staging,prod,ciand "Experiments" (traces of SDK Eval rows). None picked means all. - Filter traces: the filter language, for example
tool = submit_claim AND status = error,model ~ gpt AND score.builtin:correctness < 0.5oroutput ~ "refund". A part that's wrong is underlined, with why.inputandoutputsearch the first 500 characters of what the table shows as its input and output. - Facets: counts by status, model, tool, source (OpenTelemetry, SDK, Gateway), online scores below 0.5, tag and version. Click one to add it to the filter.
- Status: "ok", "error", or "Cancelled by caller" (
status = cancelled): the caller called the call off before it ended, as with an AI Gateway stream it closed before the last event. That is neither a success nor a failure, so the error rate on the overview, error-rate alerts and issues leave it out, and online scoring doesn't score it. - Saved views: "Save view" keeps the filter, the environment chips and the time range under a name, and "Open a saved view" brings it back. Views are kept in this browser only.
The table has "Time", "Input", "Output", "Online scores", "Status", "Latency", "Cost", "Model" and "Version", 50 per page. For a model call (an AI Gateway call, or a span with the GenAI conventions' messages), "Input" is the last user message and "Output" the reply's text, a tool call as name(arguments); the system prompt, the parameters and Gemini's thought signatures are only in the trace's panel. Anything else shows as it was sent.
A trace
Click a row. The side panel starts with one sentence ("8 spans, 2 model calls (gpt-6.1-sol), 3 tool calls, took 4.2 s, cost $0.004", and which span failed and why), then:
- Spans: the tree, indented by depth. Click a span for its kind, model, tokens in and out (and cached), cost, status, its input and output, and its attributes. A payload too large to keep inline is kept in storage: "Expand" reads it back.
- Online scores: each score with its reason and judge model, from online scoring and human review.
- Metadata, and "From experiment" when the trace belongs to an SDK Eval row.
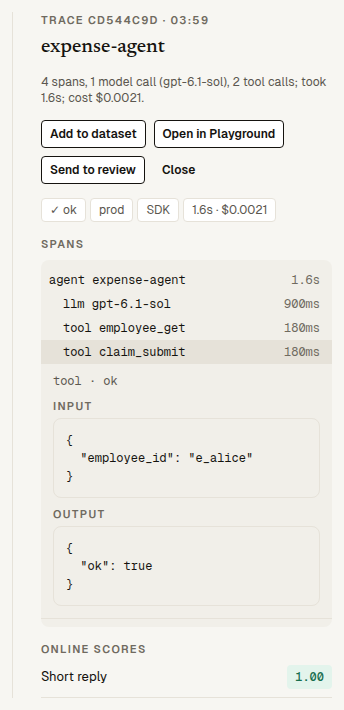
Act on traces
| Action | Where | What it does |
|---|---|---|
| "Add to dataset" | The trace's panel, or tick traces and "N selected → add to dataset" | Copies their input and output into a dataset as rows (source "Logs"), to test the next version on what really happened. Up to 500 at a time. |
| "Send to review" | The panel, or "N selected → send to review" | Puts them in a human review queue. |
| "Open in Playground" | The panel | Opens the trace in the Playground: its system prompt and model as column A, its input as the first row. |
What a trace records
| Sent through | What you get |
|---|---|
| AI Gateway | One trace per call: one span with the model, tokens, cost, the request and the reply. The environment from the x-preworld-environment header. |
| OpenTelemetry | Your spans as sent, read with the Vercel AI SDK, OpenInference, OpenLLMetry or OpenTelemetry GenAI conventions; the environment from deployment.environment.name. Cost is worked out for model spans with a known model and tokens. |
| SDK | traced functions and wrapped clients as spans; inside an Eval, each span is linked to its experiment row. |
Traces are kept for the organization's retention period (90 days by default; see retention) and then deleted. Their volume is metered as "Traces uploaded", which isn't charged for now (see pricing).
Next steps
- Online scoring and alerts: score a sample of traces as they come in.
- Issues: what the assistant finds in your traces.
- OpenTelemetry and the AI Gateway: endpoints, headers and limits.